Having trouble with the JavaScript debugger in IE11? Let’s troubleshoot the issue.
Introduction to Debugging in IE11
If you are experiencing issues with the JavaScript debugger in IE11, there are a few steps you can take to troubleshoot the problem.
First, ensure that the debugger is enabled in IE11. To do this, go to the “Tools” menu, select “Internet Options,” and then click on the “Advanced” tab. Scroll down to the “Browsing” section and make sure that the “Disable script debugging” options are unchecked.
If the debugger is still not working, try clearing your browser cache and restarting IE11. Sometimes, cached files can interfere with the debugger’s functionality.
If the issue persists, you can try using a different browser, such as Firefox or Google Chrome, to see if the problem is specific to IE11. This can help narrow down the cause of the issue.
Another option is to use an integrated development environment (IDE) for debugging, such as Visual Studio or WebStorm. These tools often have more advanced debugging features than the built-in IE11 debugger.
If none of these solutions work, you may need to consult online resources, such as Microsoft’s documentation or developer forums, for further assistance.
Understanding Error Reports and Debugging Strategies
When troubleshooting the JavaScript debugger in Internet Explorer 11, it is important to understand error reports and debugging strategies. Error reports provide valuable information about the cause of the issue, such as the specific line of code that triggered the error.
To begin debugging, open the developer tools by pressing F12 or right-clicking on the webpage and selecting “Inspect Element.” In the developer tools, navigate to the “Console” tab to view error messages and logs.
One common debugging strategy is setting breakpoints in the code. This allows you to pause the execution of the JavaScript and examine the current state of variables and the call stack. To set a breakpoint, simply click on the line number in the Source Code tab of the developer tools.
Another useful debugging technique is using the console.log() function to output messages and variable values to the console. This can help you track the flow of your code and identify any unexpected behavior.
Additionally, you can use the debugger; statement to pause the execution of your code at a specific point. This is particularly useful when trying to understand complex code or when breakpoints are not sufficient.
Remember to check for any potential software bugs or compatibility issues with Internet Explorer 11. It is also recommended to test your code in other browsers, such as Firefox or Google Chrome, to ensure cross-browser compatibility.
Analyzing Application State and Code Execution
| Scenario | Solution | Notes |
|---|---|---|
| Debugger not attaching | Check if there are any active breakpoints or debug points in the code. Clear them and try again. | Make sure to enable the “Script” debugging option in the IE11 developer tools settings. |
| Debugger skipping breakpoints | Check if there are any conditional breakpoints set in the code. Ensure the conditions are met for the breakpoints to be hit. | Make sure to disable any browser extensions or plugins that may interfere with the debugger. |
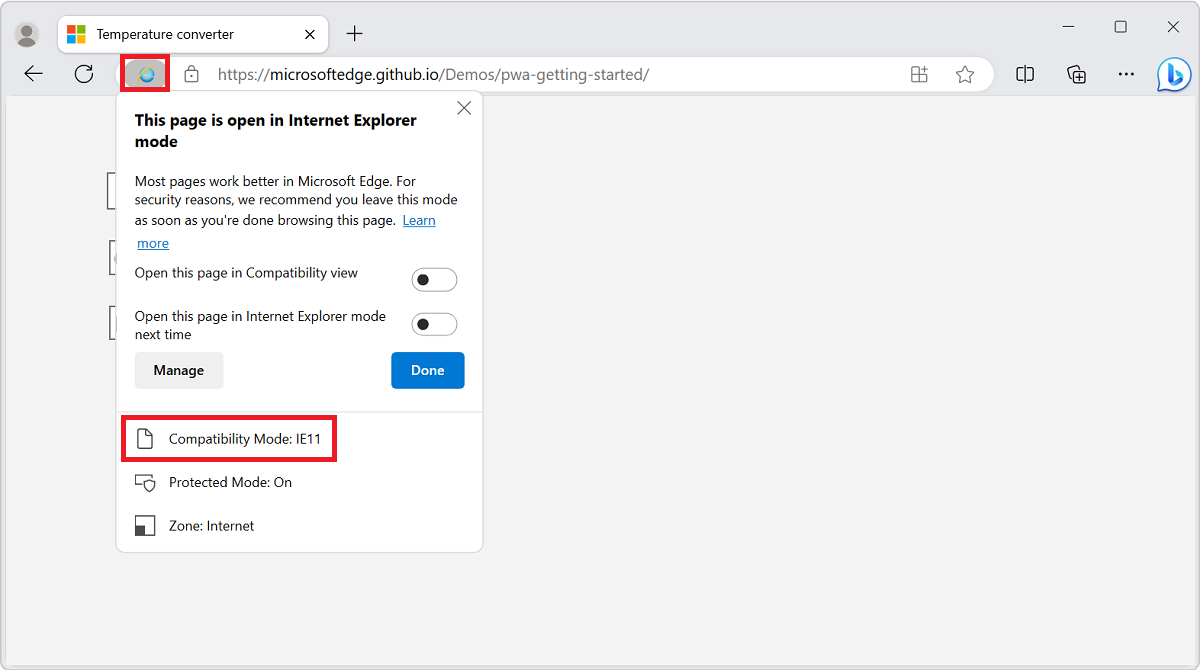
| Debugger not displaying variables | Verify if the code is executed in compatibility mode. If so, switch to a higher document mode. | Also, check if any errors are occurring in the code that prevent the variables from being shown. |
| Debugger not stepping through code | Ensure that the “Step Into” or “Step Over” options are selected in the debugger toolbar. | Additionally, check if there are any breakpoints in external scripts that may cause the debugger to jump to those scripts instead. |
…
Cross-Browser Compatibility and CSS Issues in IE11
When troubleshooting JavaScript debugger issues in IE11, it is important to consider cross-browser compatibility and CSS issues that may be impacting the functionality of the debugger.
One common issue with the JavaScript debugger in IE11 is the lack of support for certain CSS properties or selectors. This can result in the debugger not being able to properly interpret and display the styles applied to elements on the page. To troubleshoot this issue, it is recommended to check for any CSS properties or selectors that are not supported in IE11 and make the necessary adjustments to ensure compatibility.
Another potential issue is related to cross-browser compatibility. IE11 may handle JavaScript code differently than other browsers, causing the debugger to not work as expected. To resolve this, it is important to test the code in multiple browsers and ensure that it behaves consistently across all platforms. Additionally, checking for any browser-specific JavaScript code or APIs that may be causing compatibility issues can help identify and resolve the problem.
To troubleshoot the JavaScript debugger in IE11, it is also helpful to utilize the integrated development environment (IDE) provided by Microsoft. This IDE offers powerful debugging tools that can assist in identifying and fixing issues with the debugger. It allows developers to set breakpoints, examine the document object model (DOM), view the source code, and access the call stack and stack trace.
When using the debugger, it is important to understand the various features and capabilities it offers. This includes understanding how to set breakpoints at specific lines of code, how to navigate the call stack, and how to use the various debugging tools provided.
In addition to the IDE, there are also other tools and resources available that can aid in troubleshooting the JavaScript debugger in IE11. Blogs and forums dedicated to web development often provide valuable insights and solutions to common issues. Taking screenshots of any error messages or unexpected behavior can also be helpful when seeking assistance from others.
Best Practices for Monitoring and Discussion with Stakeholders
When monitoring and discussing issues with stakeholders, it is important to follow best practices to ensure effective communication and troubleshooting. Here are some tips to help you navigate the process:
1. Clearly communicate the problem: When discussing the issue with stakeholders, provide a clear and concise description of the problem you are experiencing. Use screenshots or error messages to support your explanation.
2. Use appropriate terminology: When discussing technical issues, use the correct terminology to convey your message accurately. Terms such as breakpoint, document object model, and stack trace can help stakeholders understand the nature of the problem.
3. Provide context: Give stakeholders relevant information about the web browser, application software, or server being used. This information can help them understand the potential causes and suggest appropriate solutions.
4. Share steps to reproduce: If possible, provide a clear set of steps that can be used to reproduce the issue. This will help stakeholders understand the problem and find a solution more efficiently.
5. Collaborate effectively: Use collaboration tools such as blogs or data sharing platforms to facilitate discussions with stakeholders. This will allow for transparent communication and efficient troubleshooting.
6. Be open to suggestions: Listen to the suggestions and feedback from stakeholders. Sometimes, their insights can lead to a solution that you may not have considered before.
F.A.Q.
How to debug JavaScript in IE11?
To debug JavaScript in IE11, you can use the F12 key on your keyboard or select “F12 Developer Tools” from the “Tools” menu. This will open the Developer Tools inside the browser tab. To access the Console tab, simply click on its name.
Why debugger is not working JavaScript?
The debugger is not working in JavaScript because there may be errors in the script that prevent it from running properly. Fixing these errors and ensuring that the script is executing correctly should resolve the issue. Another possibility is that the debugger’s breakpoint is set within a function or method that is never called due to a type error or other issue.
Why JavaScript is not working in Internet Explorer?
JavaScript may not be working in Internet Explorer because the Active Scripting option in the Security Settings for the Internet zone is disabled. To enable it, go to the Security tab, select the Internet zone, click on the “Custom level” button, and then enable Active Scripting in the Scripting section.
How do I debug a JS file in Internet Explorer?
To debug a JS file in Internet Explorer, you can follow these steps:
1. Reproduce the bug.
2. Familiarize yourself with the Sources tool UI.
3. Pause the code using a breakpoint.
4. Step through the code.
5. Set a line-of-code breakpoint.
6. Check variable values.