In this article, I will analyze Windows BSOD dump files.
Setting Up for Minidump Creation

1. Enable minidump creation: Open the Control Panel and go to System. Under the Advanced system settings, click on the Settings button in the Startup and Recovery section. In the System failure section, select the “Write an event to the system log” option and enable the “Automatically restart” checkbox. Choose the “Small memory dump (256 KB)” option from the drop-down menu.
2. Verify dump file location: By default, Windows saves minidump files in the %SystemRoot%\Minidump folder. Double-check this location to ensure that dump files are being saved correctly. If necessary, you can change the dump file location in the Startup and Recovery settings.
3. Check for sufficient disk space: Minidump files can occupy disk space, so make sure there is enough free space available. Clean up unnecessary files or consider allocating more disk space if needed.
4. Configure Windows Error Reporting: Windows Error Reporting can interfere with minidump creation. Disable it by opening the Control Panel, selecting System and Security, and clicking on Action Center. From there, click on “Change Action Center settings” and uncheck the “Windows Error Reporting” option.
5. Ensure system stability: Before diving into analyzing dump files, it’s crucial to ensure that the system is stable. Address any underlying hardware or software issues to prevent recurring BSODs.
By setting up minidump creation correctly, you’ll have the necessary data to effectively analyze Windows BSOD dump files and troubleshoot system crashes.
Understanding Memory Dump Settings
– Memory dump settings in Windows
– Types of memory dumps
– How to change memory dump settings
– Importance of memory dump analysis
– Common errors and issues related to memory dumps
Understanding Memory Dump Settings:
Memory dump settings in Windows allow you to gather crucial information about system crashes, such as the infamous Blue Screen of Death (BSOD). There are different types of memory dumps, each providing varying levels of information for analysis.
To change the memory dump settings, follow these steps:
1. Press Win + R to open the Run dialog box.
2. Type sysdm.cpl and press Enter to open the System Properties window.
3. Go to the Advanced tab and click on the Settings button under the Startup and Recovery section.
4. In the Write debugging information dropdown, choose the desired memory dump type:
– Small Memory Dump: Provides basic crash information, typically sufficient for most troubleshooting scenarios.
– Kernel Memory Dump: Contains more detailed crash information, including kernel-mode components.
– Complete Memory Dump: Captures the entire contents of system memory, useful for in-depth analysis.
Analyzing memory dumps is essential for identifying the root cause of system crashes. By examining the dump files, you can pinpoint faulty drivers, hardware issues, or software conflicts that lead to the BSOD.
However, memory dumps can occasionally encounter errors or issues. If you encounter problems with memory dumps, ensure that your system has enough disk space to store the dump files. Additionally, make sure your system is not configured to automatically restart after a crash, as this can prevent the creation of memory dumps.
Generating Memory Dumps: Tips and Tools
- Enable Automatic Memory Dump
- Open Control Panel by clicking on the Start button and selecting Control Panel.
- Select System and Security.
- Click on System.
- On the left side, click on Advanced system settings.
- Under the Startup and Recovery section, click on Settings.
- In the Write debugging information section, select Automatic memory dump from the dropdown menu.
- Click OK to save the changes.
- Manually Generate Memory Dump
- Open Task Manager by pressing Ctrl+Shift+Esc.
- Click on the Processes tab.
- Find the process associated with the program or system that crashed.
- Right-click on the process and select Create Dump File.
- Wait for the memory dump file to be generated.
- Note down the location of the generated memory dump file.
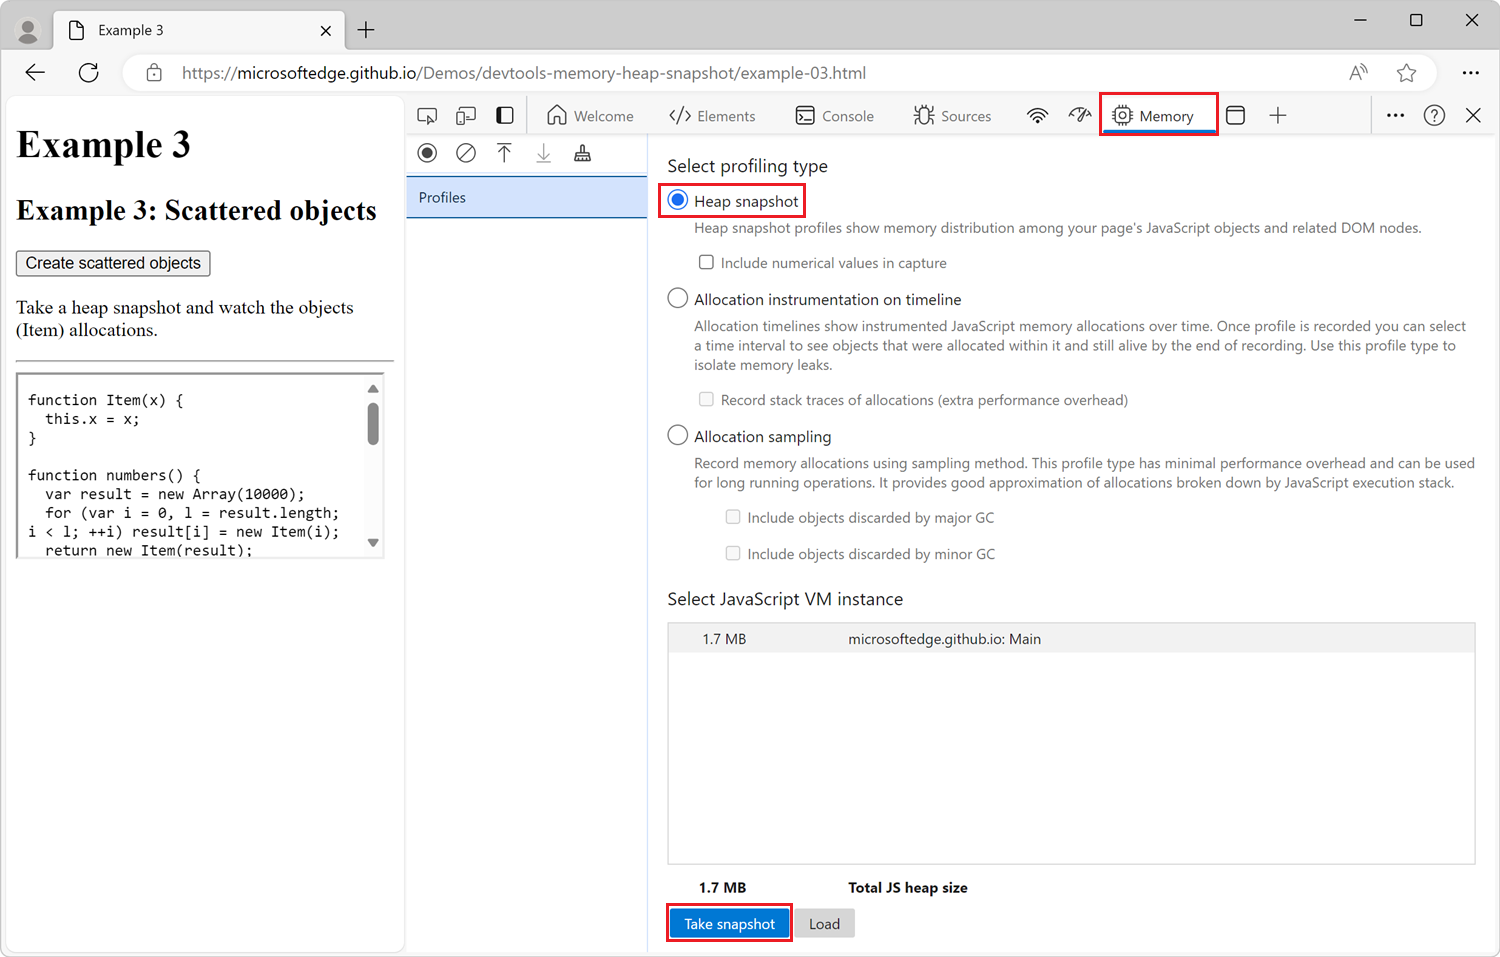
- Use Third-Party Tools
- Download and install a reliable third-party memory dump tool such as Windows Debugging Tools or WhoCrashed.
- Launch the tool after installation.
- Follow the on-screen instructions to generate memory dumps.
- Review the generated memory dump files using the tool’s analysis features.
BlueScreenView: Analysis and Utilities
| Tool Name | Description | Download Link |
|---|---|---|
| BlueScreenView | Allows you to analyze the MiniDump files created during Blue Screen of Death (BSOD) crashes. It displays information such as the crash address, time, and bug check code, making it easier to identify the cause of the crash. | Download |
| WhoCrashed | A similar tool to BlueScreenView, WhoCrashed also analyzes crash dump files and provides information about the drivers or modules that might be responsible for the system crash. | Download |
| Windows Debugger (WinDbg) | A powerful debugging tool provided by Microsoft, WinDbg is useful for analyzing memory dump files and diagnosing complex BSOD issues. It provides advanced features for kernel-mode and user-mode debugging. | Download |
| OSR Online Crash Dump Analyzer | An online tool that allows you to upload crash dump files for analysis. It provides detailed information about the crash, identifies the problematic drivers, and suggests potential solutions. | Access Analyzer |
FAQ
How do I get a BSOD dump?
To get a BSOD dump, go to Control Panel > System and Security > System. Click Advanced system settings, then select Startup and Recovery. Enable the “Write an event to the system log” option and choose “Kernel memory dump”.
How do I get the crash dump on Windows?
To obtain the crash dump on Windows, navigate to Control Panel, then System and Security, and select System. From there, access the Advanced system settings and go to the Advanced tab. Under the Startup and Recovery section, click on Settings. Ensure that either Kernel memory dump or Complete memory dump is chosen for Writing Debugging Information.
What is blue dump in Windows?
Blue dump in Windows, also known as the blue screen of death or BSOD, is an issue that occurs when there is a hardware failure, driver problem, or conflicts with recently installed or updated programs on a PC.